
How fast are commercial electricity rates rising? Now we have the data.
A few weeks ago we posted a blog post with a snapshot of commercial electricity rates across the US - how demand charges vary widely state-to-state, and how the type of cost (demand vs. energy) should drive completely different infrastructure strategies.
The immediate follow-up question is: are these rates moving? Are utilities adjusting their tariff structures as EVs become a bigger piece of commercial load?
We went back to the same dataset (nearly 63,000 rate filings from utilities across the US) and this time tracked rates by the date each tariff became effective. Here is what the trend looks like.
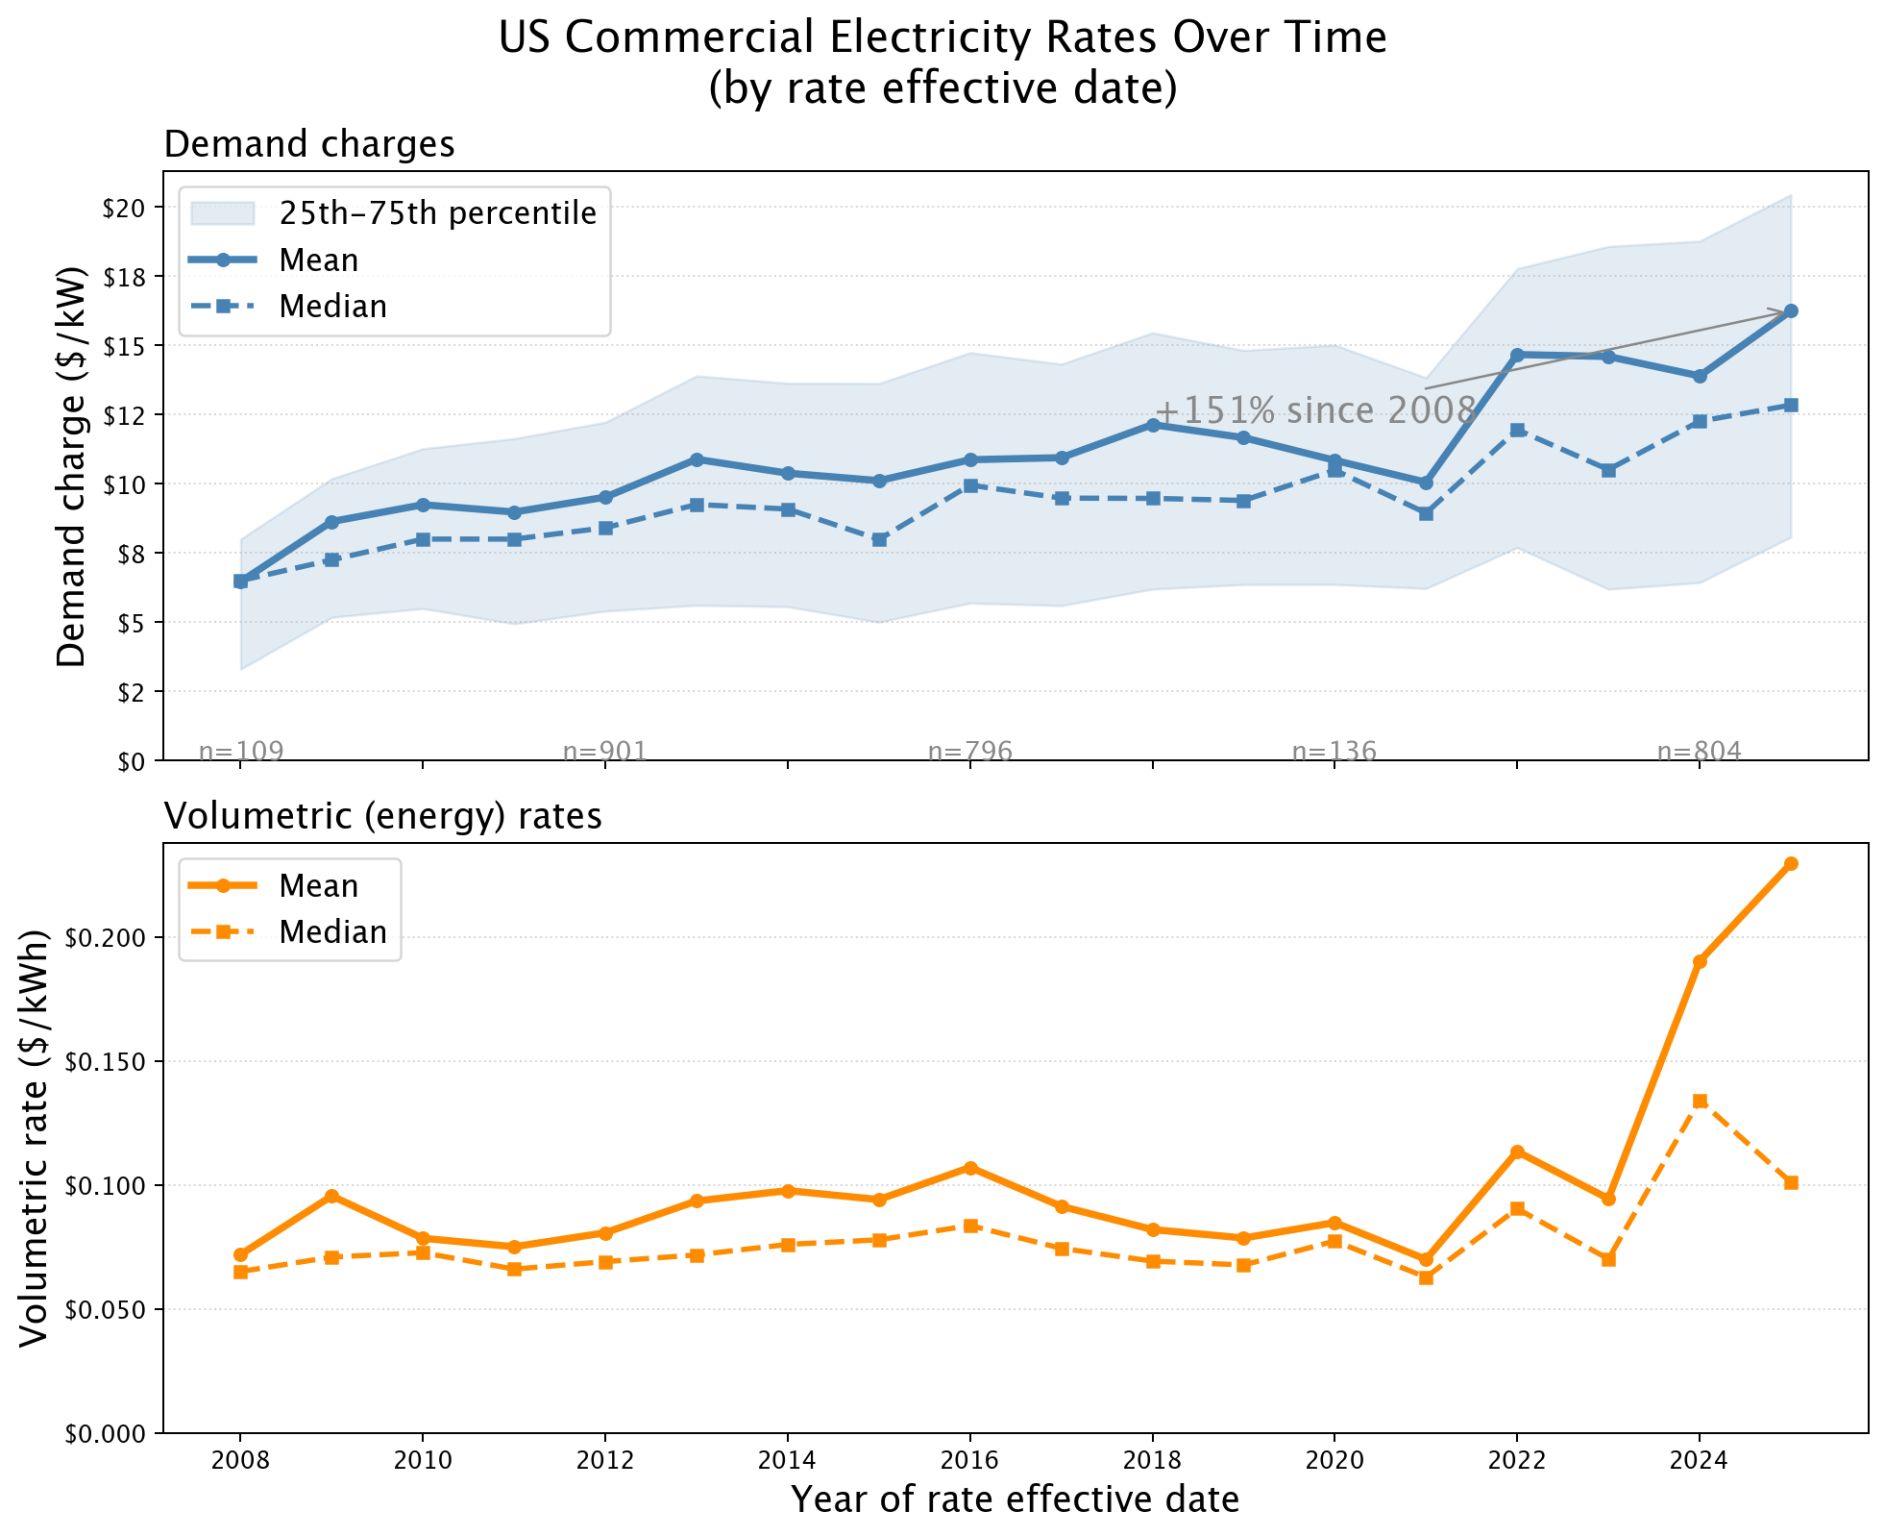
Demand charges have risen sharply. The national mean stood around $7/kW in 2008. By 2025 it had reached $16/kW - a rise of over 100% in seventeen years. The acceleration has been notable since 2021, with mean demand charges climbing roughly $1.50/kW per year over the last four years. The median has risen more slowly, which tells us part of the story is a thickening tail of high-rate tariffs rather than a uniform increase across the board.
But the more dramatic move has been in volumetric (energy) rates. After nearly a decade of flat-to-modest growth, energy rates spiked sharply in 2022 and again in 2024. This is almost certainly reflecting fuel cost pass-throughs during the energy price shock, now being locked into long-lived tariff filings.
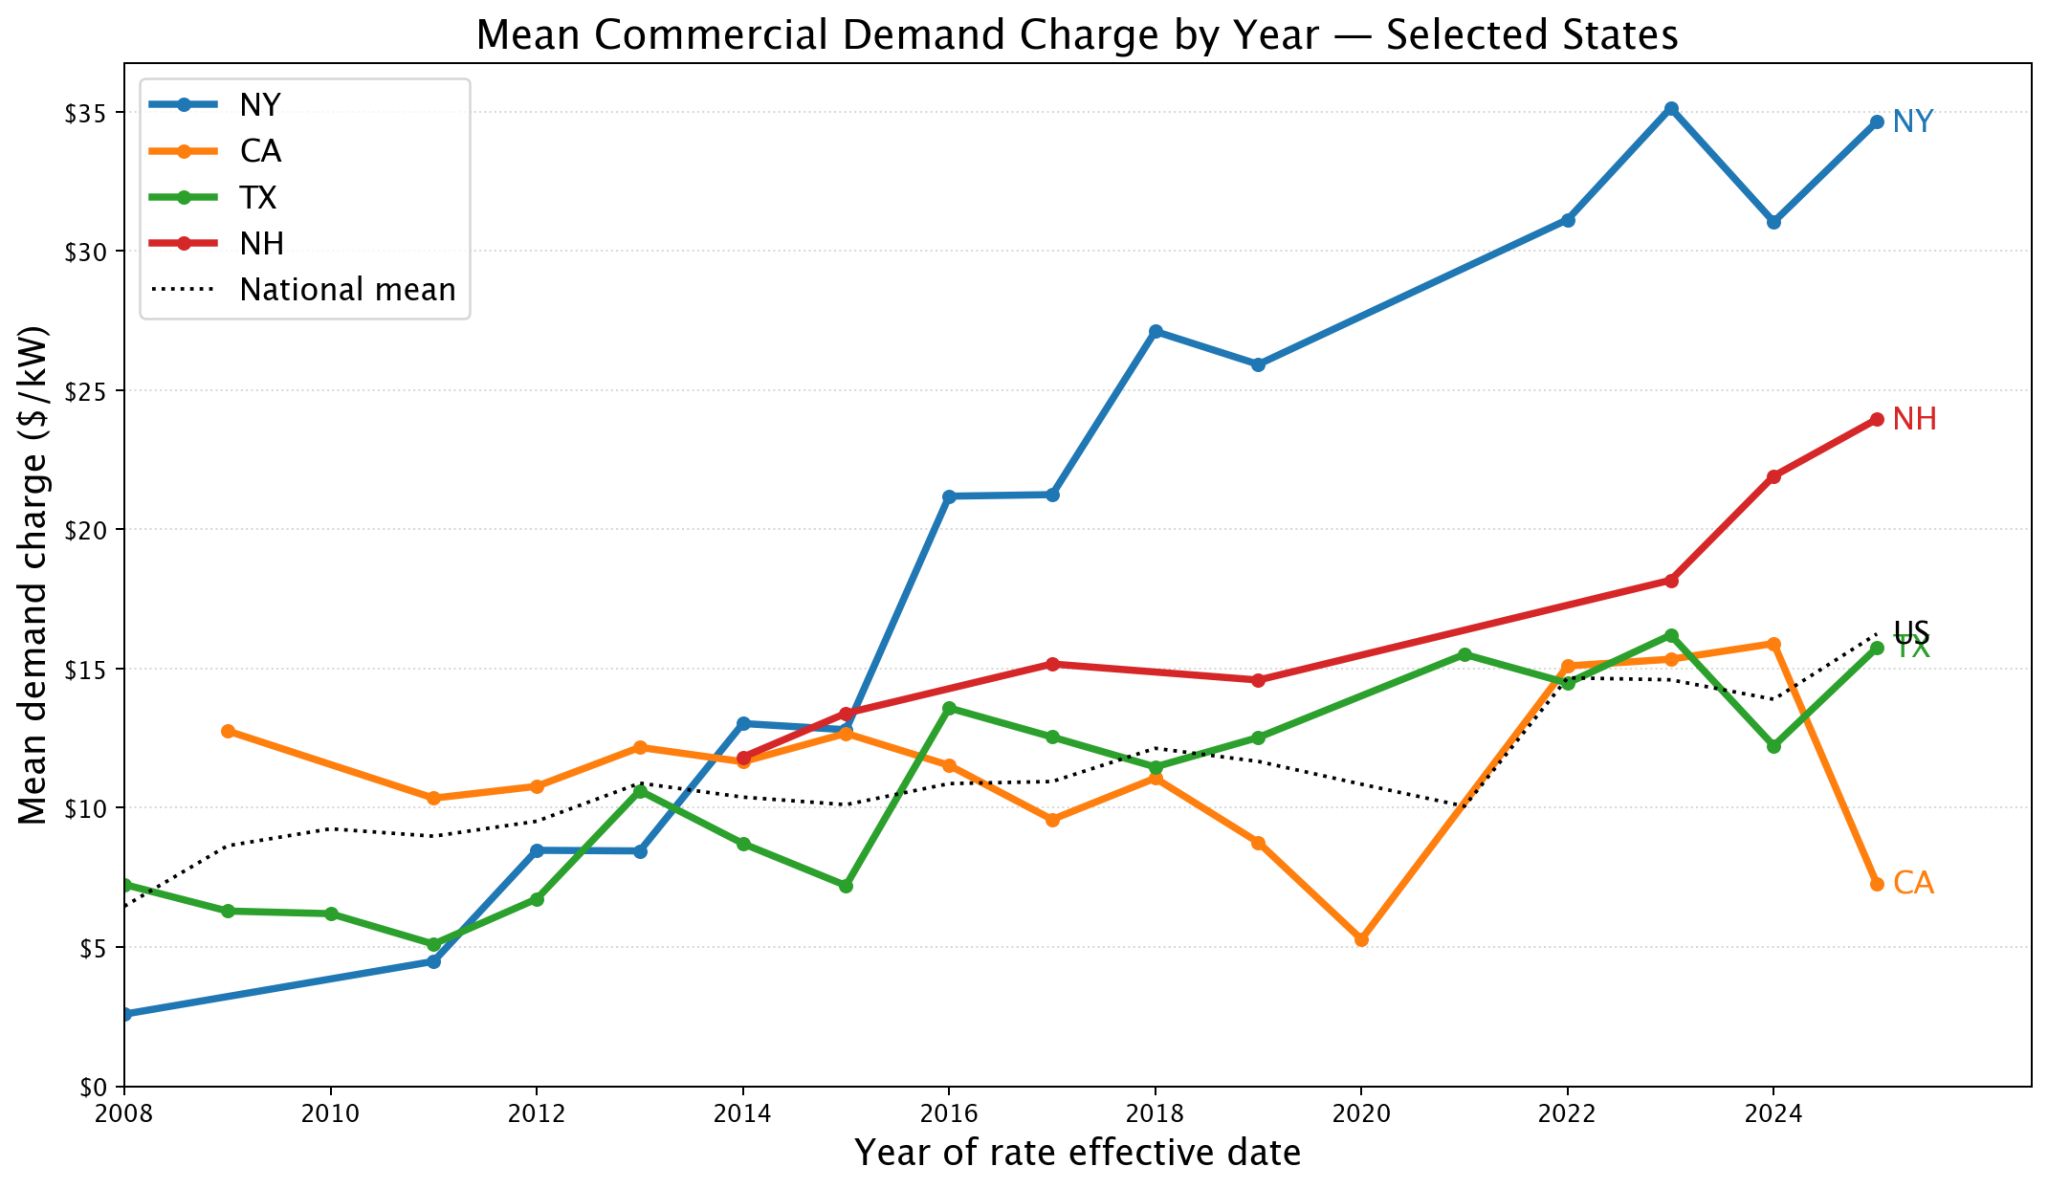
Of course, individual states tell different stories. New York's demand charges have risen from roughly $5/kW in 2008 to over $30/kW by 2024 - the steepest trajectory we see for any large state. Wyoming has gone from around $8/kW to $18/kW, driven by rural utility cost structures and limited competitive pressure. California and Texas have risen more modestly, and both have specialized EV tariff programs that partially shield operators from the full increases. Michigan has consistently run high demand charges - in the $12–15/kW range throughout the period - reflecting the economics of its large investor-owned utilities. New Hampshire, which looks unremarkable on demand, has seen its volumetric rates climb steadily and now sits among the most expensive in the country for energy.
The direction of travel matters as much as the current level. An operator signing a lease for a charging hub today is implicitly betting on what rates will look like in five to ten years. The trend lines don't suggest rates will stabilize on their own.
This is one of the core problems we work on at evPower.ai: helping operators understand what their tariff structure actually costs, and building the systems - smart load management, battery dispatch, cost control - that protect the economics as rates continue to rise.
Data
US Utility Rate Database (USURDB) — maintained by NREL and OpenEI. Nearly 63,000 tariff records.
Methodology for trend analysis:
- Filtered for approved commercial rates with a valid effective date in the range 2008–2025
- Extracted max effective demand charge (rate + adjustment) across all tiers and time periods
- Same extraction for volumetric ($/kWh) rates
- Per-year national means and medians computed across all qualifying records
- Per-state means computed with a minimum of 3 rate filings per year to suppress noise
- 2026 excluded as incomplete year
Note: rates are indexed by their effective date, not by when they were filed or when they appear in the database. A rate effective in 2015 that is still in force today would appear only in the 2015 data, not in 2024. This means the trend chart reflects new rate filings by year, not a snapshot of all active rates.