
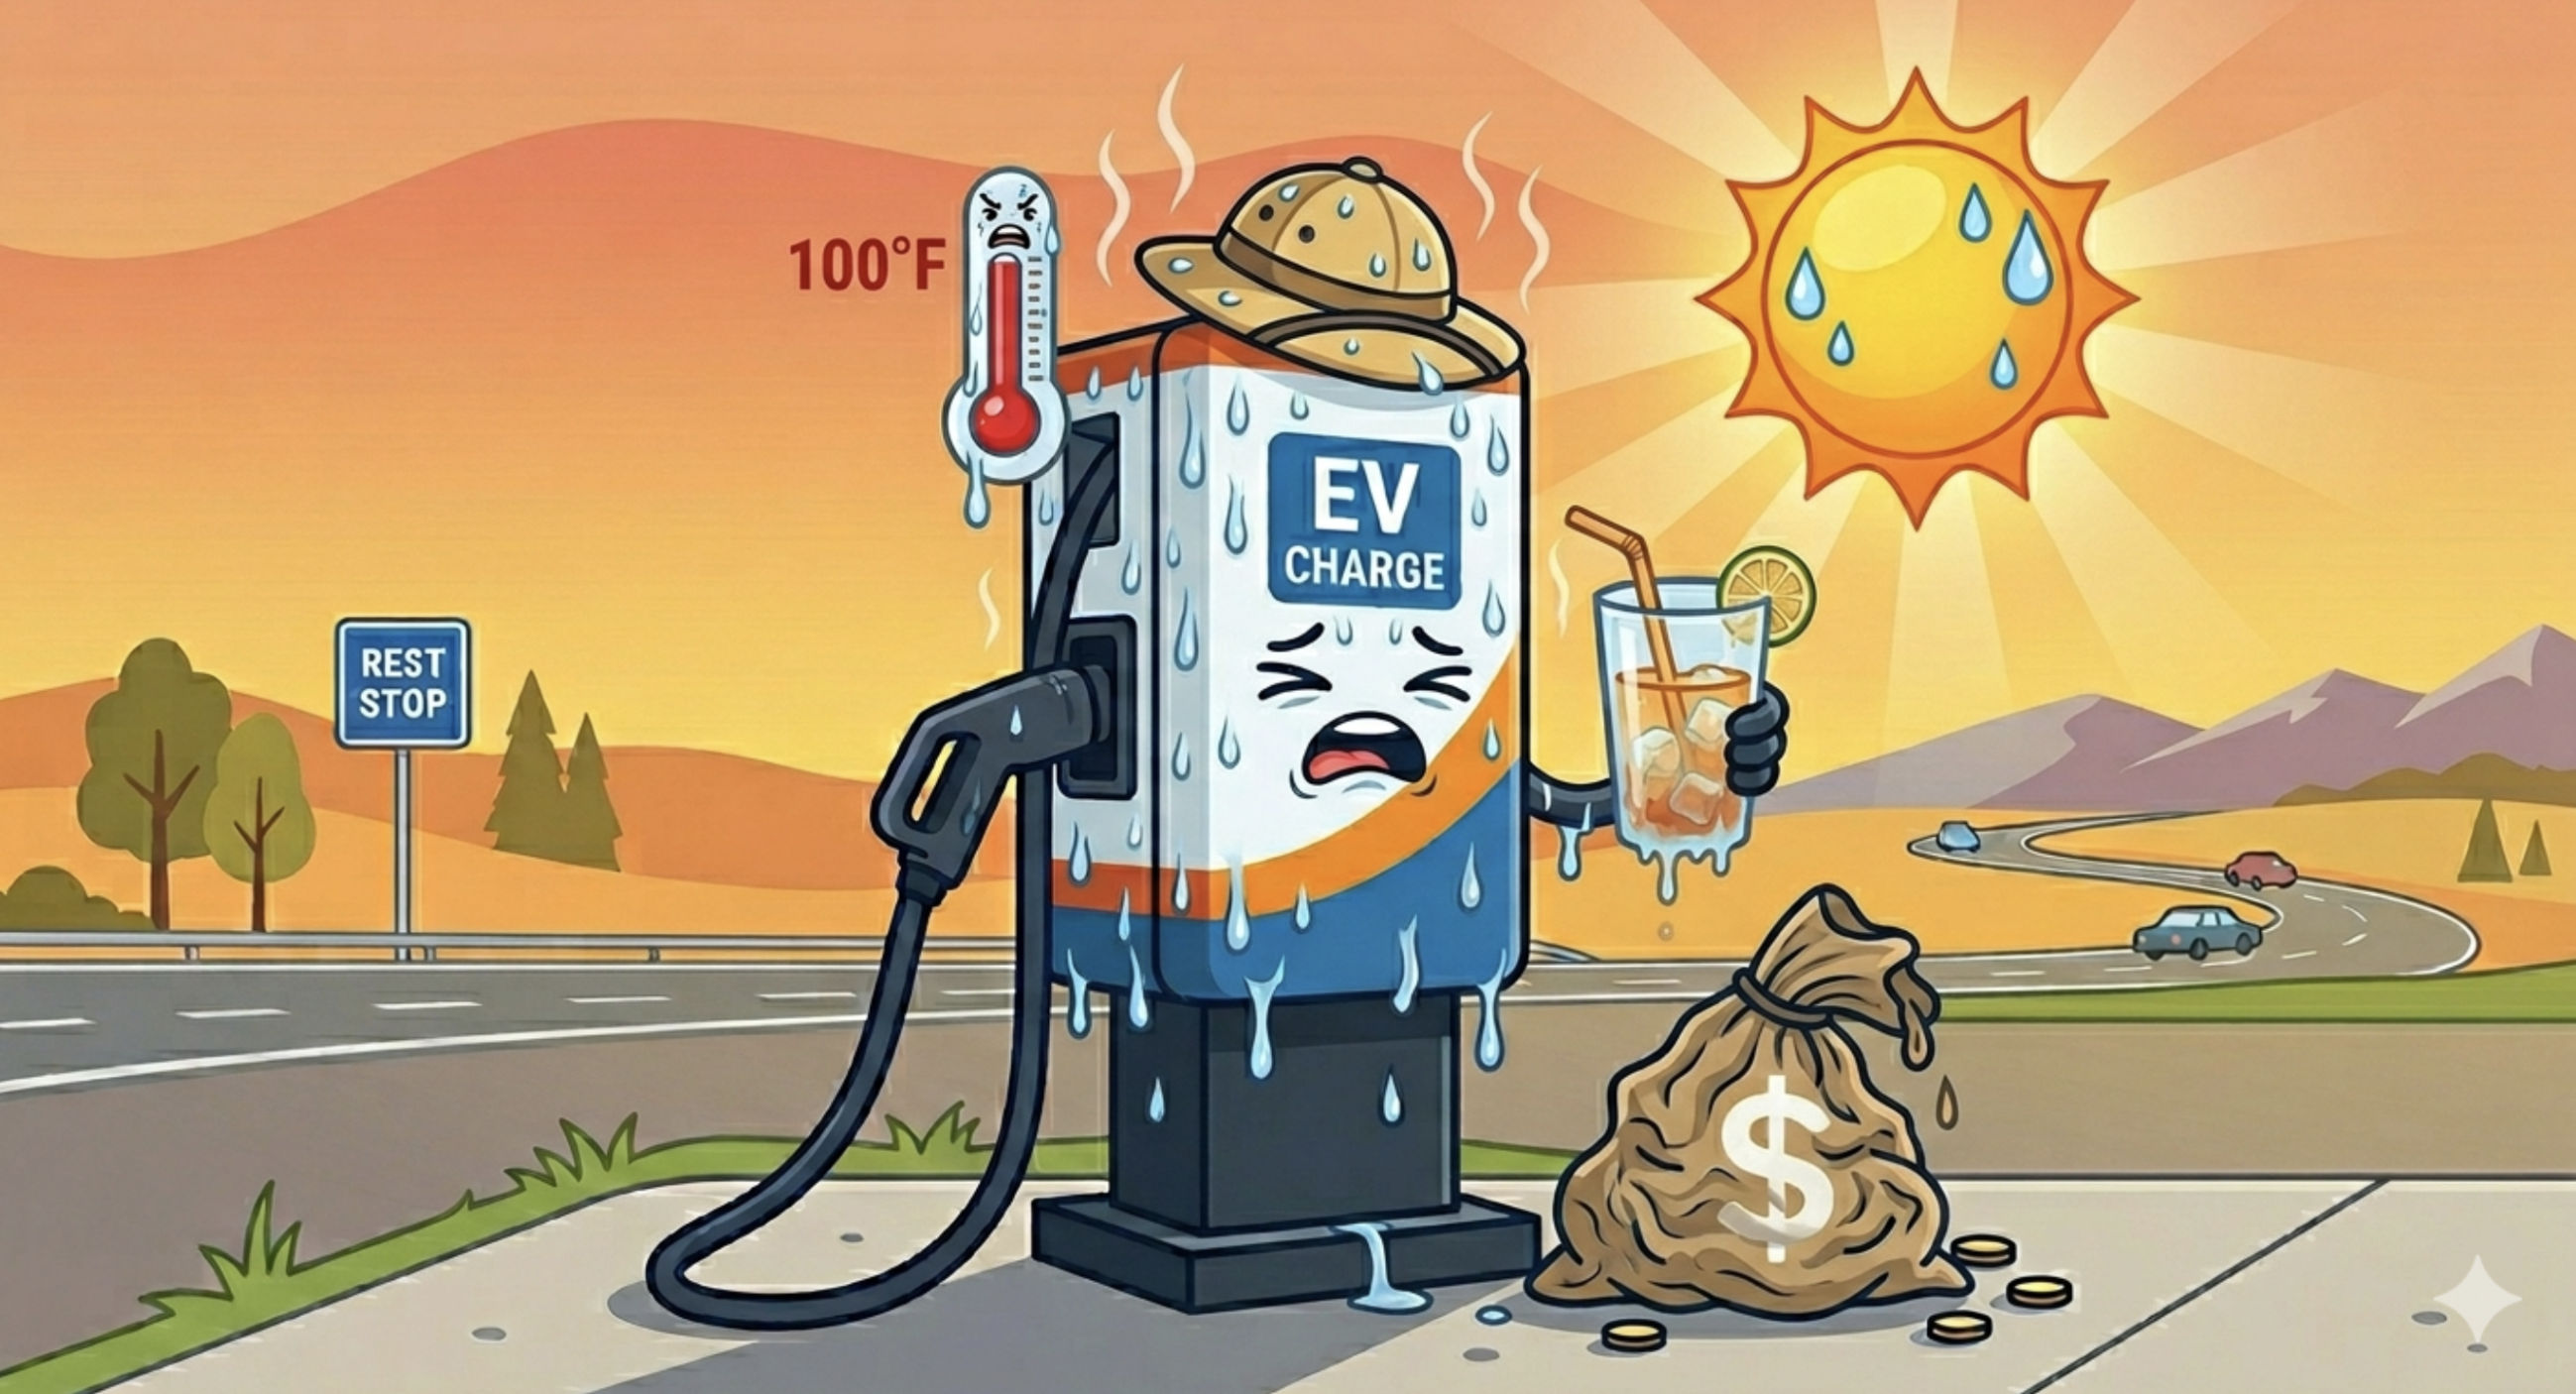
 Most operators know heat shortens equipment life. Fewer realize it's quietly draining revenue every hot day — no alarms, no failures, just money quietly left on the table.
Here's what's actually happening inside the cabinet: Above certain temperature thresholds, DC fast chargers deliberately reduce output power to protect their electronics. A 180 kW charger operating in extreme heat may throttle down to 153 kW — a 15% reduction that the driver barely notices, but that ripples through the entire station's economics.
We modeled a realistic 8-stall DCFC station through a typical summer day and quantified each link in the chain.
At 45°C (heatwave conditions):
Sessions run 51 seconds longer on average. That sounds minor, but across a busy station it means 26 more minutes per day with fewer than 3 vacant connectors. Under the assumption that drivers waiting more than 5 minutes tend to leave, our simulation shows roughly 5 additional abandonments per day — drivers who went to a competitor. The daily revenue loss compared to full-power operation: $38 (multiplied by the number of hot days for the month).
That figure only counts the direct throttling effect. Electrical resistance also increases with temperature, meaning some of the power drawn from the grid — power you pay for — is wasted as heat inside the charger before it ever reaches a vehicle. Factoring in this efficiency loss, the daily profit impact rises to $61. And again, if there are additional extreme-weather days during the month, this adds up quickly.
At 50°C (extreme heatwave):
Throttling deepens. Sessions extend a further 45 seconds. Congestion worsens significantly. The compounding efficiency hit pushes total daily profit loss to $116.
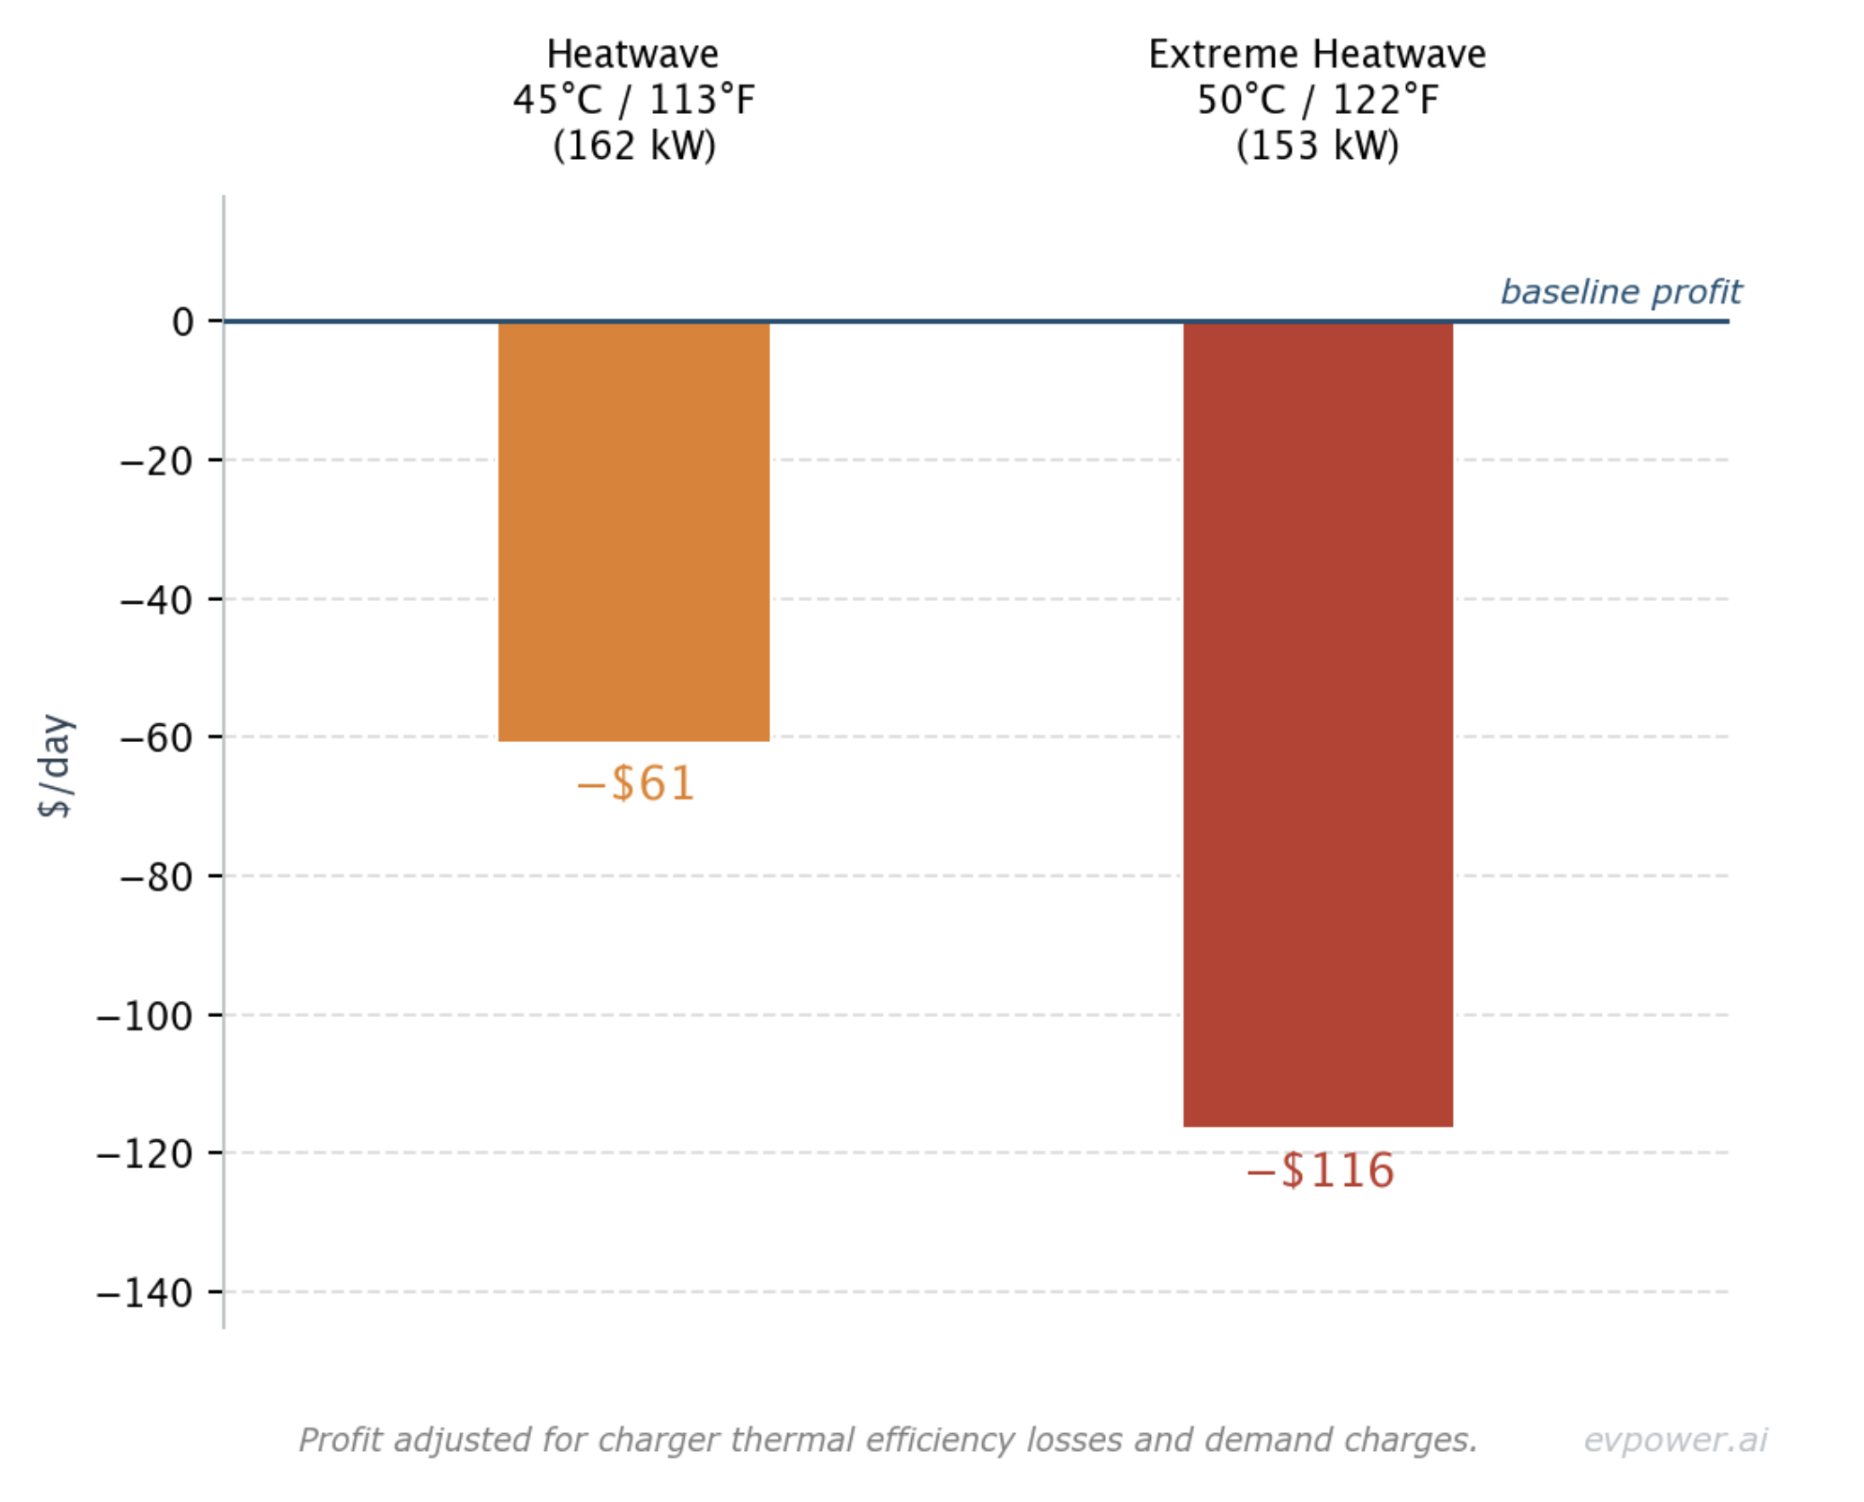
One result surprised us: demand charges do not significantly compound the problem. The power spike from the charger's cooling system largely offsets the reduction in peak charging output — a counterintuitive wash. (We've detailed the accounting in the methodology notes.)
The numbers are from the digital twin we built at evPower.ai. It models charger and power constraints, realistic driver behaviors, and charge curves of vehicles for the specific market, all to arrive at insights, sizing decisions, and real-time power control.
As we head into the hottest months of the year, we're offering to run this analysis for your charging site free of charge — specific to your equipment, your location, and your traffic patterns.
Methodology notes
A few details for those who want to go deeper:
Methodology: we used evPower.ai's digital twin simulation platform with Monte Carlo sampling over driver arrival patterns (highway/shopping mix), vehicle mix corresponding to Texas, and a station with 4 dual-connector 180kW chargers with no oversubscription.
The three scenarios correspond to charger power limits of 180 kW (baseline), 162 kW (moderate heatwave, ~45°C), and 153 kW (extreme heatwave, ~50°C). These are representative figures — actual derating thresholds vary by manufacturer and model.
The efficiency penalty was modeled as a 2% grid-to-vehicle loss at 162 kW and 5% at 153 kW, reflecting increased resistive heating in cables and power conversion stages.
Demand charge assumed at $20/kW/month on 15-minute peak demand windows. Energy arbitrage at $0.30/kWh. Vehicle set-up time: 3 minutes.