
In the previous blog we discussed how commercial electricity rates vary across US states - demand charges ranging from $6/kW to $34/kW, and energy rates telling a completely different story, with Alaska and New York at the top and Idaho and Arkansas at the bottom.
The two rankings barely correlate, and this turns out to be the most useful finding in the data. When scorng each state by how its demand charge rank compares to its energy rate rank - scaled from +1 (high demand, low energy) to -1 (low demand, high energy).
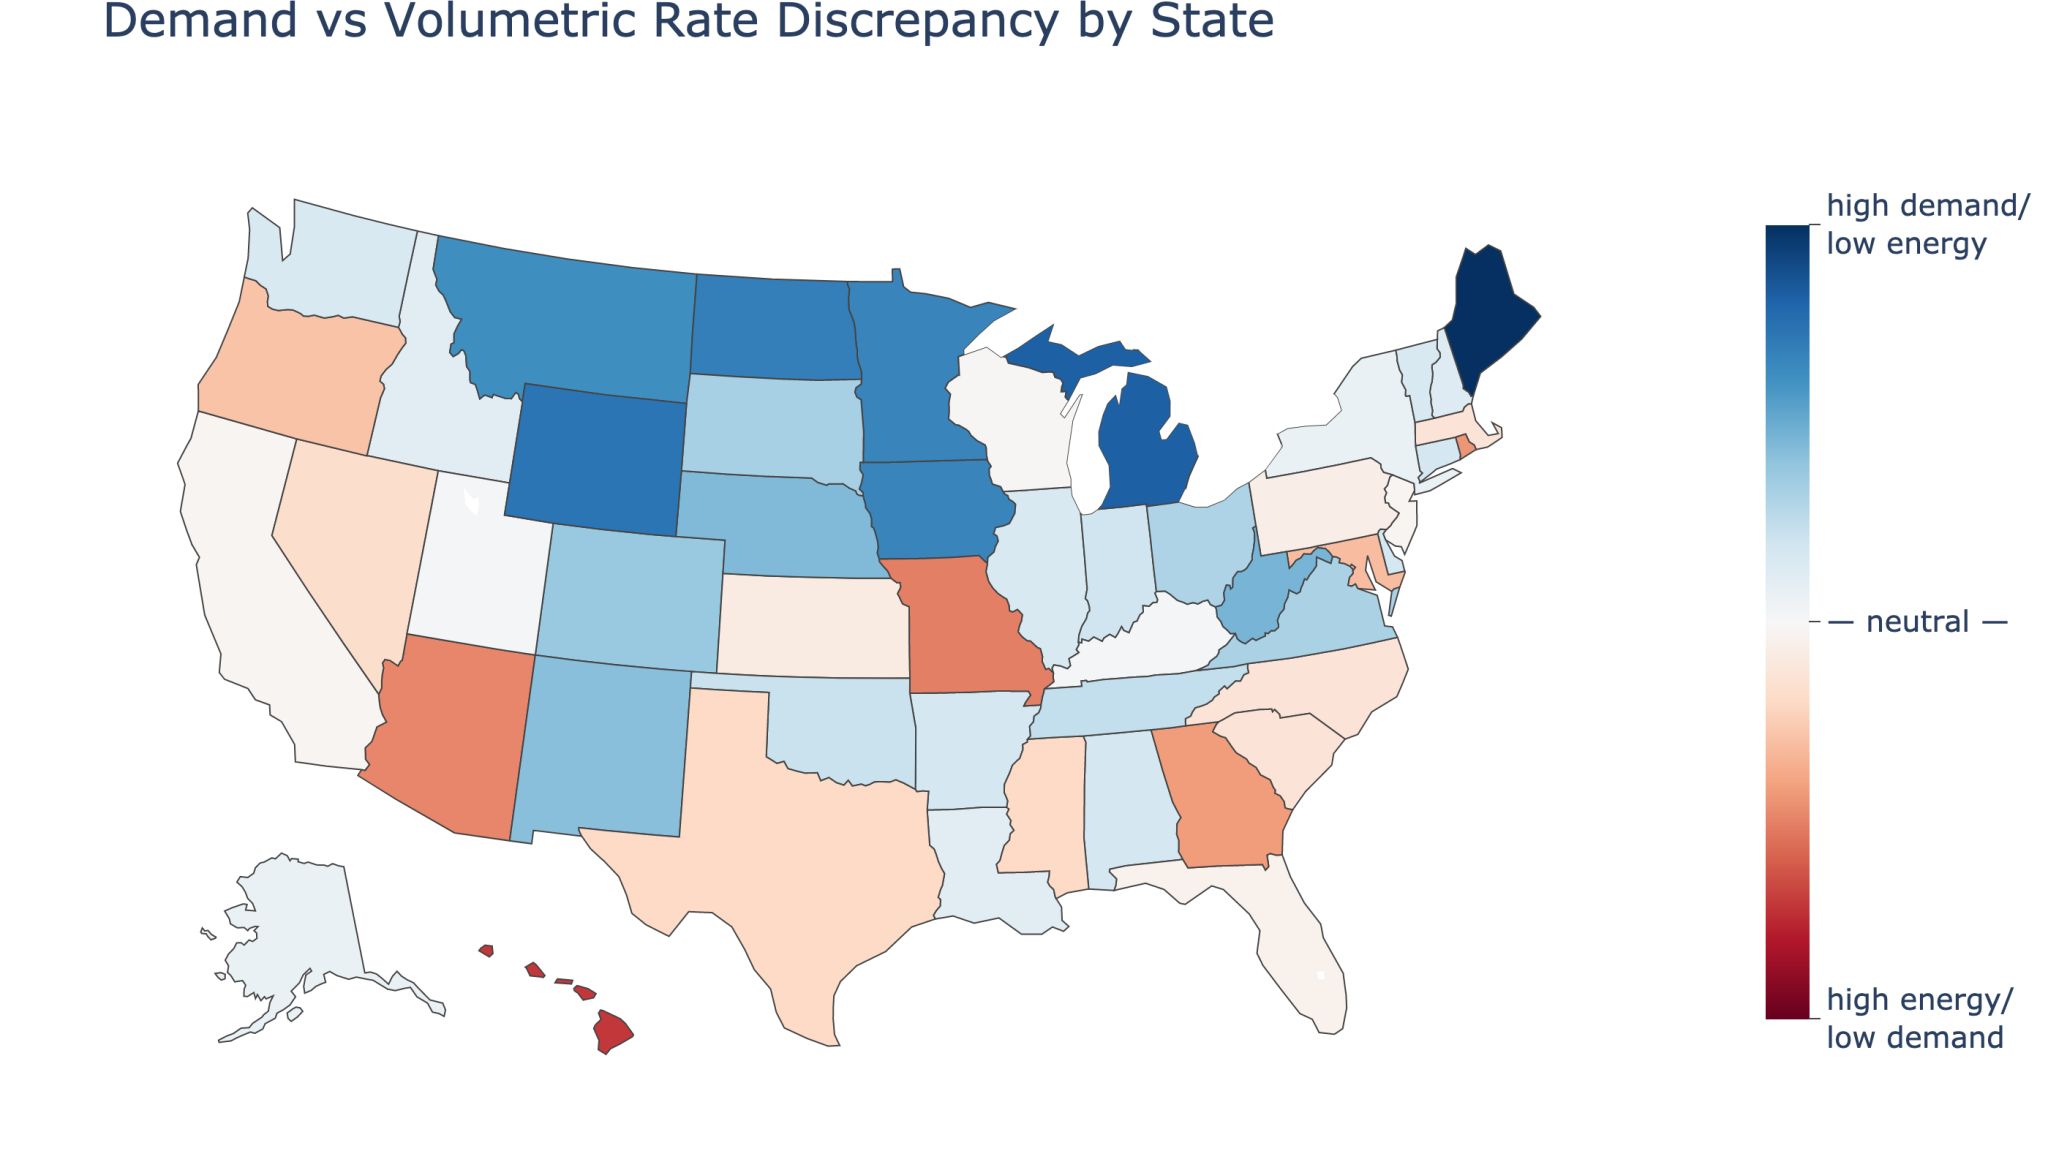
Some states penalize peak power draw heavily but charge relatively little per kWh: Maine, Michigan, Wyoming, Iowa and Minnesota. In these states, smart load management - through dynamic power allocation, battery storage, or power capping - has the greatest potential to reduce operating costs. A 350kW site in Maine at $20/kW that cuts its peak by 50kW saves 50 × $20 = $1,000 every month, without serving a single fewer session.
Others show the opposite pattern - charging relatively more for energy than for peak demand (e.g., Hawaii, Arizona, Rhode Island,Missouri). Here, solar generation and time-of-use arbitrage deliver more value than peak shaving.
The hardware is often the same. It’s the software that matters - managing power allocation, maintaining driver experience, and controlling battery dispatch. Do this right, and you can reduce costs without touching the chargers and without degrading the driver experience. The levers are already there. Most operators are just not pulling them.
If you are operating EV charging infrastructure and want to know where your state and utility fall on this map - and what it means for your monthly bill - reach out. I’ll be happy to run a free tailored analysis for your site.
Data source:
US Utility Rate Database (USURDB) - a public dataset maintained by the National Renewable Energy Laboratory (NREL) and OpenEI, containing nearly 63,000 electricity tariffs from utilities across the country.
Methodology:
- Filtered for approved, in-effect commercial sector rates (endDate null or in the future)
- Extracted max effective demand charge (rate + adjustment) across all time periods and tiers, from demandRateStrux or flatDemandStrux
- Extracted max volumetric rate from energyRateStrux on the same basis
- Per-state means were computed across all matching rates for that state. Mean is taken over all applicable tariffs, not over number of enrolled customers nor cumulative energy volume (that's more accurate, but we don't have access to this data).