Real-World EV Charging: From the 80% Rule to Revenue Efficiency
Data-driven insights from evPower.ai on real-world EV charging behavior and revenue optimization.
Introduction
Most EV professionals know the textbook charging curve: power tapers as batteries approach full capacity, and many drivers are taught to unplug around 80%. But how does that rule hold up in a crowded, multi-model station? And what does it mean for charge-point operators (CPOs) who care about throughput and revenue, not just theory?
Using large-scale field data from the DESL–EPFL repository and evPower.ai's own digital-twin simulations, we explore three linked questions:
- Is the 80% rule myth or fact in real-world traffic?
- How does tapering translate into actual wait-time for drivers?
- Does higher stall utilisation always equal higher revenue?
Each section builds on the last, giving CPOs a holistic view of performance drivers—and levers to pull.
Want to optimize your charging network?
See how evPower.ai's digital twin can model your specific site conditions and driver patterns.
1. The 80% Rule in Practice
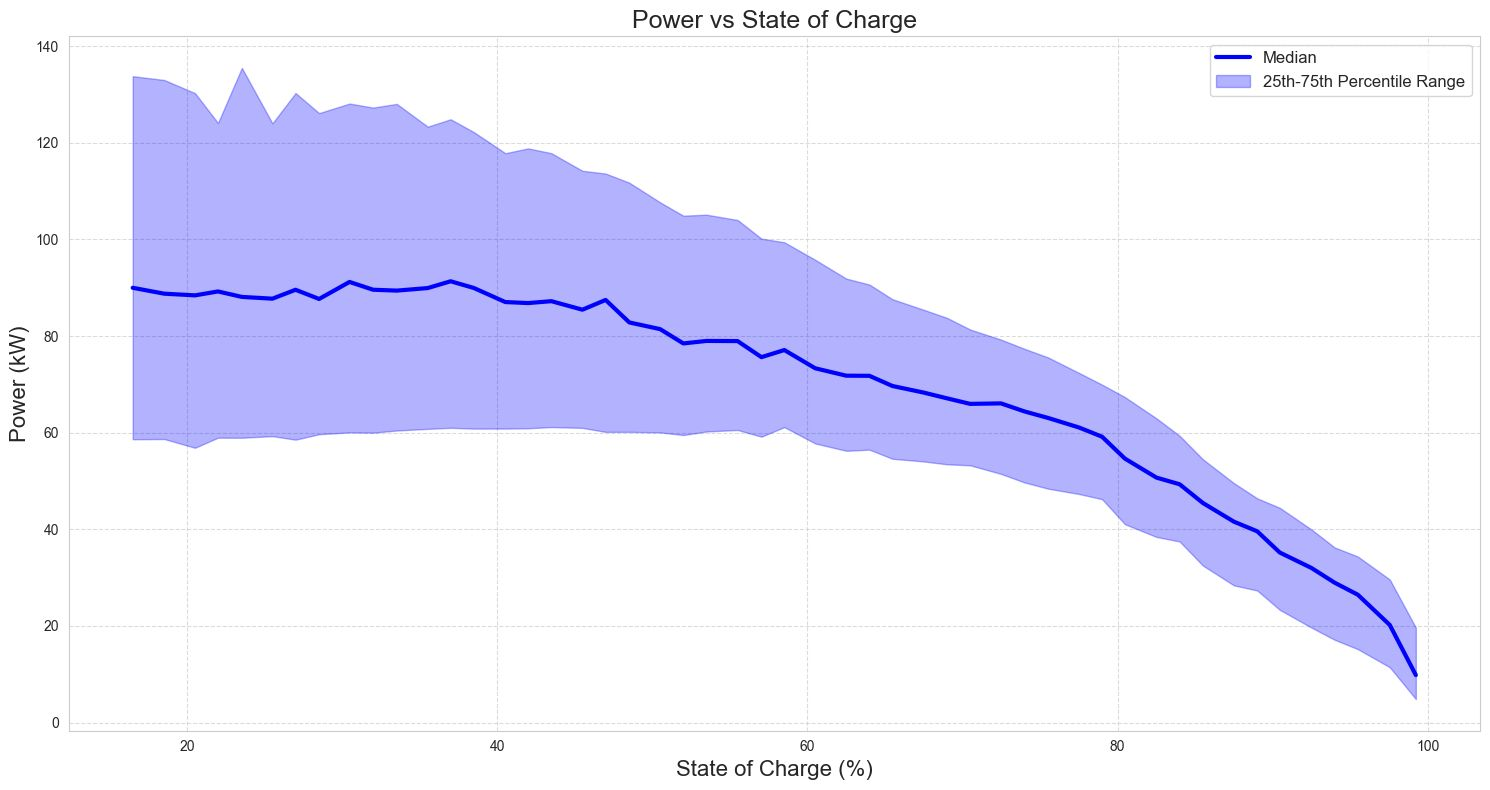
Figure 1: Aggregated charging power vs. State of Charge (SoC)
Large-scale measurements confirm the familiar curve, but aggregation smooths the edges:
- Below 60% SoC: Power varies widely across car models.
- Above 60% SoC: Curves converge; every model throttles to protect its battery.
Implication: Load-management algorithms and tariff structures must account for the universal taper, not just single-model curves, or risk idle hardware and dissatisfied drivers.
2. Charging Time vs. Starting SoC
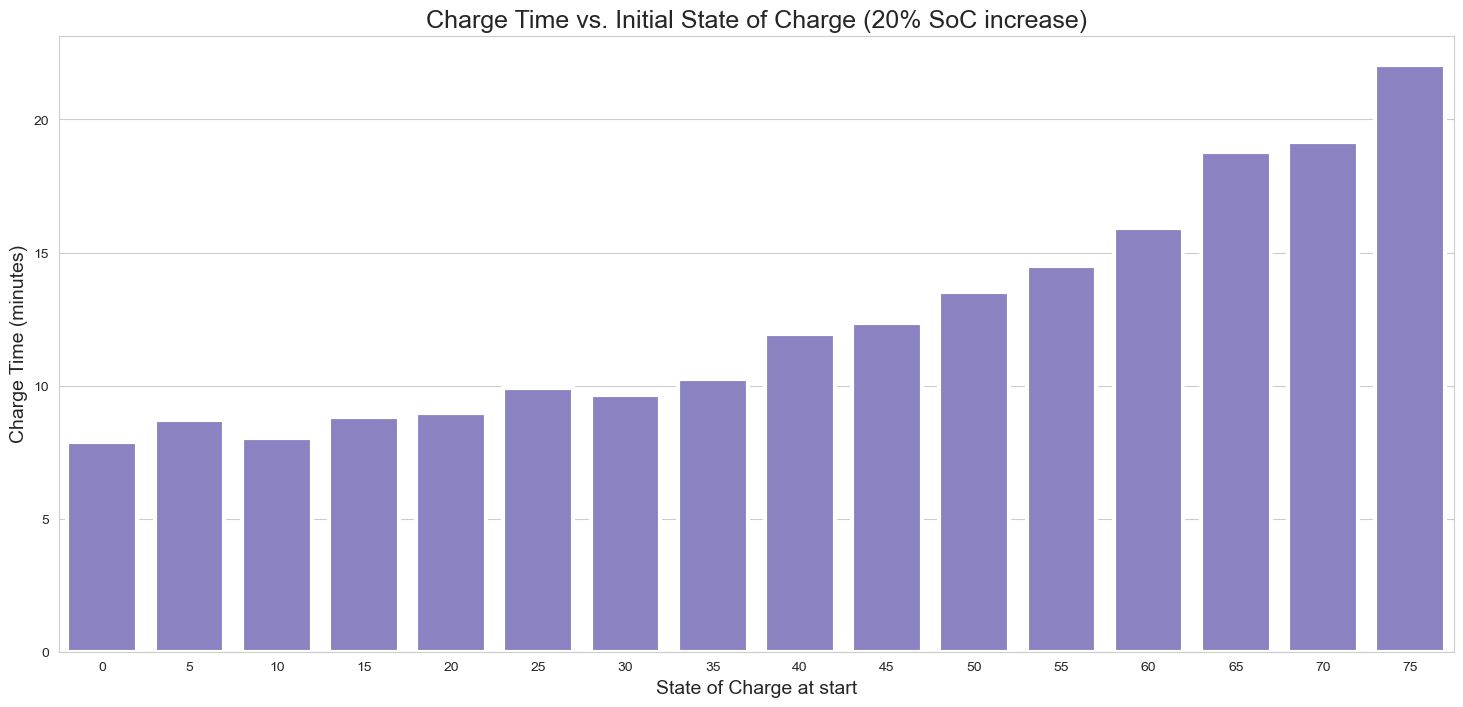
Figure 2: Minutes required to add 20% SoC from different starting levels
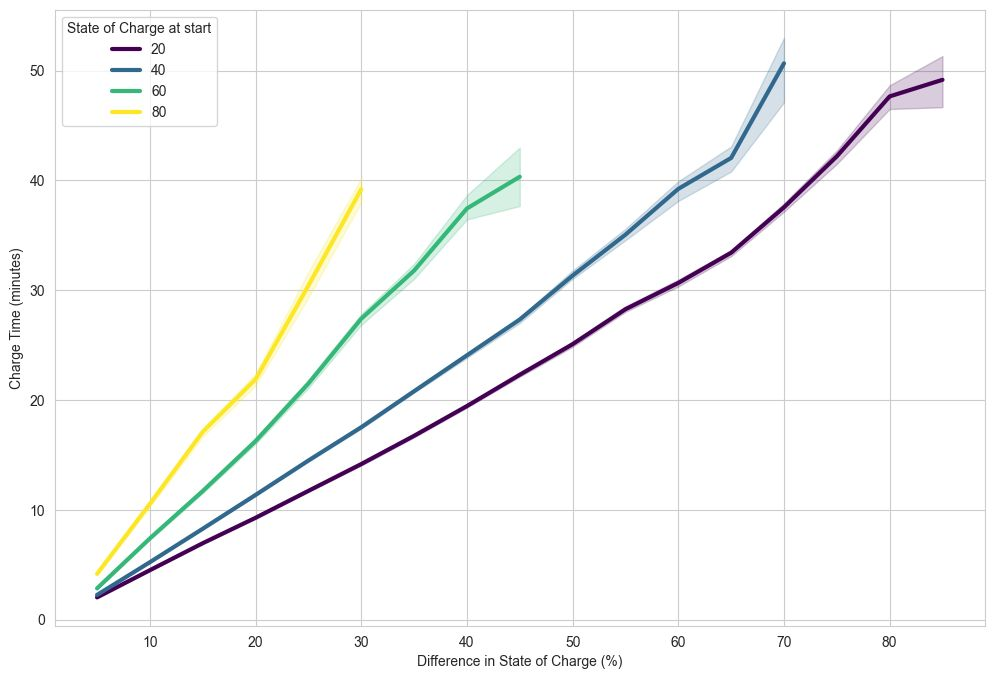
Figure 3: Heat-map: total session time vs. starting SoC & desired SoC gain
Turning power curves upside-down reveals a driver's true pain point—time:
- Adding 30% from 20% SoC is roughly 15 minutes faster than from 60% in our dataset.
- Heat-maps let drivers (and apps) predict dwell time and help CPOs design dynamic queues or pricing tiers.
Key takeaway: Encourage "sip" behaviour—top-ups from lower SoC—to boost throughput and customer satisfaction.
Maximize Your Station Throughput
Learn how dynamic pricing and smart load management can increase your revenue by up to 25%.
Get Custom Quote3. Utilisation vs. Revenue: Two Station Archetypes
Using evPower's digital twin, we modelled an 8-stall site under two realistic patterns:
| Scenario | Typical Behaviour | Session Goal |
|---|---|---|
| Highway | Short stops, quick top-ups | Add ~20% SoC fast |
| Shopping-mall | Long stays, near-full charge | Park & shop |
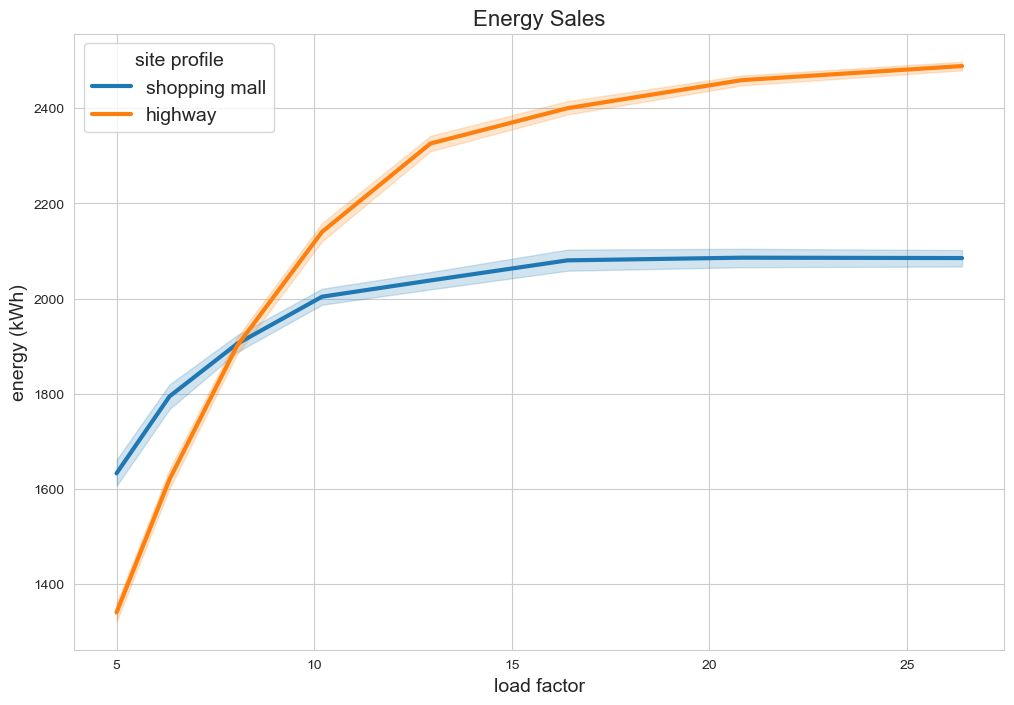
Figure 4: Energy sold vs. demand level
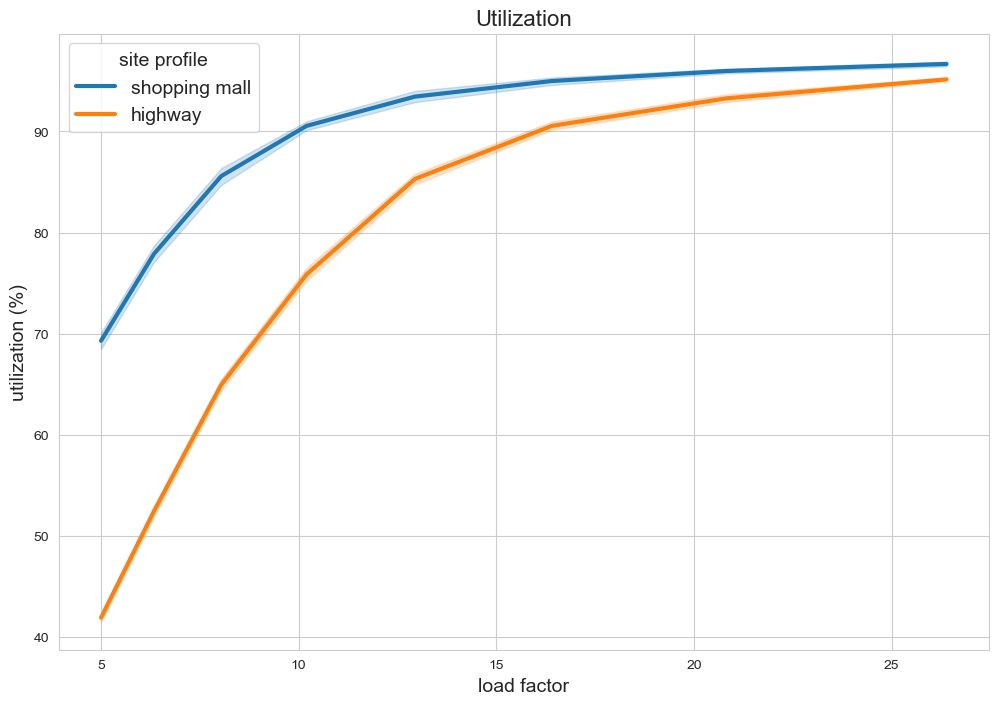
Figure 5: Stall utilisation (%) vs. demand level
Findings
- Under peak demand, the Highway setup sold ~25% more kWh despite lower occupancy.
- At identical 70% utilisation, energy throughput diverged by hundreds of kWh.
Strategic implications
- Hardware mix: Pair ultra-rapid stalls for "in-and-out" drivers with slower AC bays for lingerers.
- ROI forecasting: Model utilisation and session composition; hours-busy alone can mislead.
- Dynamic pricing: Reward short, high-power sessions during congestion to maximise kWh per connector.
Ready to Optimize Your Network?
evPower.ai's digital-twin platform delivers site-specific simulations in days, letting network owners quantify the impact of driver mix, charger mix, and tariff tweaks before committing capital.
Conclusion & Next Steps
Optimising an EV charging business is no longer about adding more metal; it is about understanding behaviour, taper, and time—then designing software, hardware mix, and pricing accordingly.
evPower.ai's digital-twin platform delivers site-specific simulations in days, letting network owners quantify the impact of driver mix, charger mix, and tariff tweaks before committing capital.
Want to dive deeper into your network's data?
Contact our team to discuss how these insights apply to your specific charging infrastructure.